4 Jun: Sellers try a push down to BRN and then it rockets
4 June 2019
Pre-open scenarios
Yesterday the market filled gaps from 30th May and was 2pts short of the ex-gap from 28 May. The closing gap from 28th May was filled ON and is therefore still officially open, so it should attract the market today. There is also an important daily TL in the same area, which the market has tested in the US session and ON, so this will be another level that should act as a magnet in today’s session.
Below that there is the daily cash chart 50MA at 11987, so there is some really hefty resistance above. With the TL hit, and the gaps filled, the market has no more reasons to keep moving upwards, unless this is the start of something more significant. The way the market reacts to these levels today and the depth of the retrace that sellers can force will provide some useful information about the market’s direction in the coming weeks.
Daily cash 1-month and 3-month charts


Futures open
Futures opened at 11990
- Gap of +18pts against the cash close and -6pts against the futures close.
- Ex-gap of 2pts above the yesterday’s high.
H4 and H1 charts just prior to cash open

Time stamp: 8:50 (CET)
Scenarios
Best fit, if there is one, is highlighted in red at the end of the day.
Scenario 1: goes up to fill gaps from 30th May at 12027 and then ranges all day with support at 11900
Scenario 2: sells straight from the open and trends down all day
Scenario 3: reverses down to support at 11950 and then breaks upper TL, triggering further gains towards the unfiled gaps at 12168 (22 May) – almost spot on except that high was much lower and as the TL break soon reversed
What would be today’s easiest trade(s) if they set up?
Selling a touch of the upper TL/unfilled gap at 12027.- Buying 11900/pivot/H1 169.
After the cash close
End of day H4 and H1 charts

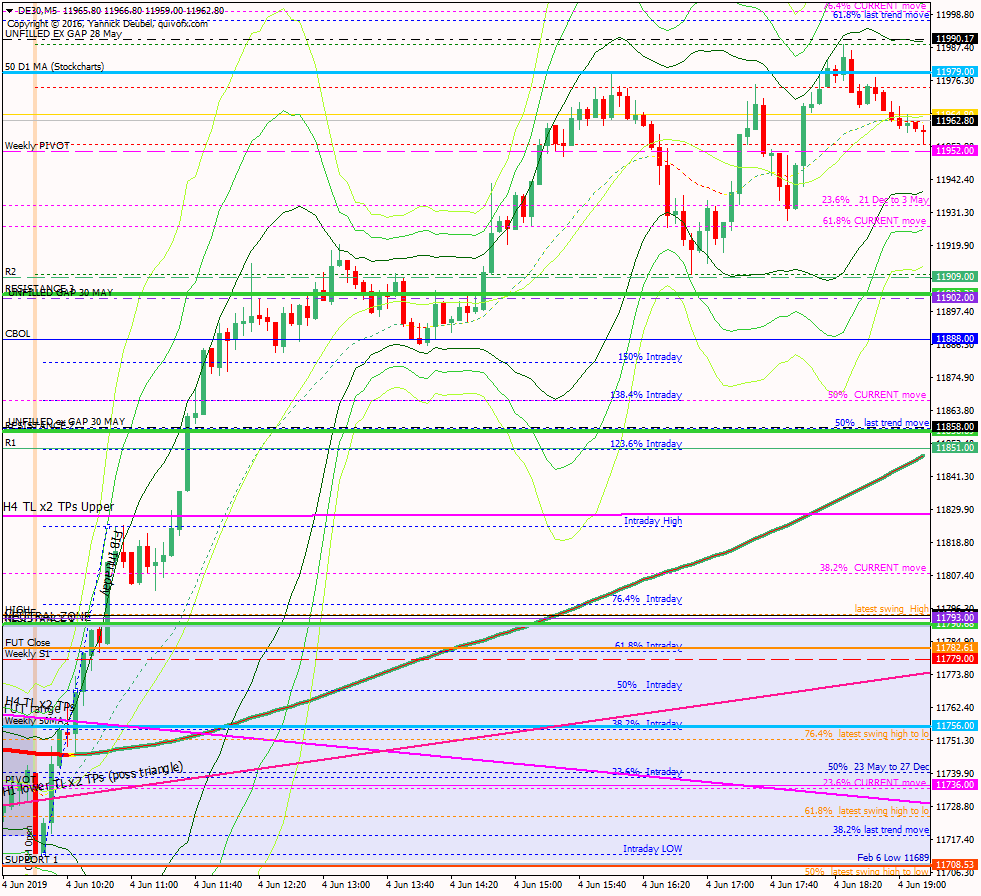
Intraday M5 chart

Core trading hours PA M1 (9am to 11am)

Key points about today's PA and setups that worked
The daily TL broke as expected, but the market didn’t do much with it – except filling the unfilled gap from May 28.
- At the open, the market vibrated around the TL and then broke back in to make a low just below the weekly pivot
- From there it saw strong buying that barely paused for a 100pts – powering straight through yesterday’s high, the daily 21MA, Futures close and even the unfilled gap at 12027
- It then made an inverted ‘V’ reversal at the monthly pivot
- After losing more than half the session gains, it bounced off the KLs at yesterday’s high, futures close, 21MA area
- A stair-step move lead the market up to make a double top at the monthly pivot
- After that, it trended down to make new lows for the day, but it paused at KLs along the way and the M5 169 provided support for several bars and when that broke there was an impulse move back down to the TL which broke, but this was quickly reversed
How effective was my Neutral Zone?
Each day, I would define a neutral zone within which, PA could be deemed directionless.
The lower boundary wasn’t in play and there was more selling after the break above the upper boundary – the unfilled gap from 28 May was the real level, judging by the level that was retested after the market reversed from the monthly pivot.
How precise were my levels?
No SUP levels were in play and as applies above for the upper boundary of the Neutral Zone, RES would have been better placed at the unfilled gap from 28 May.
What I did

TOTAL = 1.1R | # Trades 15 | Winners 4 | BE 3
Average R per winner = 2.4 | Losses > 1R = 0 | Scratched = 0
R-multiples: trades 2:1 or more = 4 | trades 5:1or more = 5
Outcome using standard TP strategy and same trades
2:1 trades (4R) + 5:1 trades (2 x 2.5R) + BE (0R) + Losses (-8R) = +1R
My results vs. SYS = +0.2R
ON TILT trades = 3 (-3R)
Today's most gorgeous setup
The 3Min Bolli at the weekly pivot for 9R. Weekly pivots are strong, strong levels and always need to be traded if they set up as 3Min BBs.

For reference: 6 month cash chart at COB yesterday


