
20 May: Fills the gap then it’s curtains for the bulls
20 May 2019
3 Jun: Dips down to 200MA and then gains 180pts
3 June 2019
Pre-open scenarios
When I look at the daily chart, I cannot decide whether this is a new downtrend or not. I could call it corrective, but the moves are too large for a corrective phase. There is undoubtedly a new lower high around 12311 and a new lower low yesterday. While that is all true, price is the boss and the six-month chart screams ‘uptrend’. For this to start looking like a new downtrend, the market would need to break 11850-800 decisively. The 61.8% fib of the move since the beginning of the year is 11600.
So what about today? Will the market just digest yesterday’s move and range between 12127 and 12041. Or will the supporting the TL that has formed in the US session and ON, break and lead to move down towards the daily 50MA at 11905 and then the weekly 50MA at 11797. I know that the market loves these levels, and they are both BRNs. There will most likely be a lot of orders at these levels, so they will act as a magnets if the bears get control.
Daily cash 1-month and 3-month charts


Futures open
Futures opened at 12101.
- A gap of +20pts against the cash close and +60 against the futures close.
- The futures open was within yesterday’s range, so there are no ex-gaps.
H4 and H1 charts just prior to cash open

Timestamp: 8:40 (CET)
Scenarios
Best fit, if there is one, is highlighted in red at the end of the day.
Scenario 1: ranges between 12127 and 12041
Scenario 2: sees early relief buying up to 12127 or even 12177 and the reverses to break the supporting TL and retest yesterday’s lows
Scenario 3: fills the gap at 12041 and then makes a stair-step move up to 12127 or 12177
Scenario 4: fills the gap, sees very minor buy-in and then breaks TL to trend down all dayNone of the above, but I was right about the high –
After the cash close
End of day H4 and H1 charts

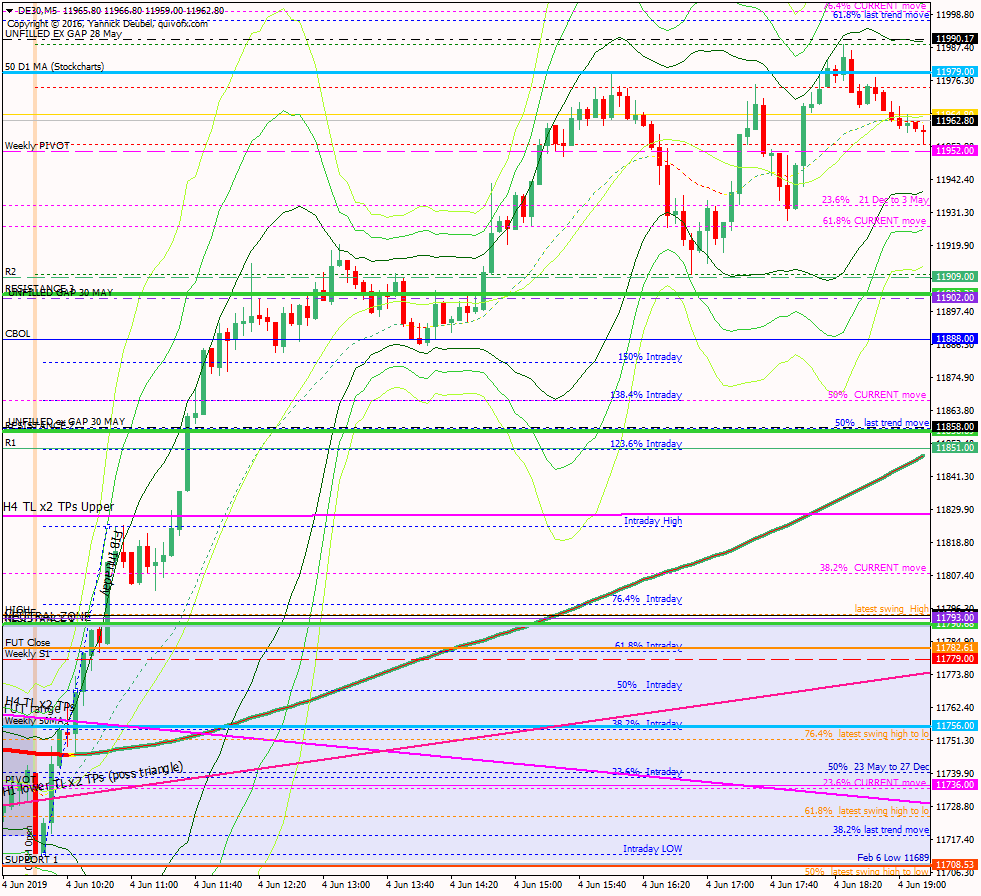
Intraday M5 chart

Core trading hours PA M1 (9am to 11am)

Key points about today's PA and setups that worked
The market meandered up today, moving steadily up along the supporting TL shown on the H4 and H1 charts above
- The first level to react was the monthly pivot at 12111 – price was also just outside the 3Min Bolli when it hit and there were 10pts between the entry and the opening price
- From there the market sold down to 12062 – I couldn’t see any reason for this to be the reversal except that it was 50% fib of the current move, 38.2% of the last trend move and also 23.4% from Feb to May this year – so perhaps just the confluence of three was enough – anyway the Dax doesn’t have to reverse at one of my levels – I just need it to do it often enough to give me an edge
- That formed a new LOD which triggered some enthusiastic buying – enough for the market to move up to break above the monthly pivot, pausing at the 169 as it made its move.
- The new HOD triggered trades and the market was sold down to an in intraday fib from where it reversed to my RES 1 and again – as a new HOD – this was sold down to the 61.8% fib. From there the market reversed and made a new high – targeting the 50% fib of the most recent move.
How effective was my Neutral Zone?
Each day, I would define a neutral zone within which, PA could be deemed directionless.
The lower edge of my zone was 12041, which was cash gap close – so that was not in play; the upper boundary was the weekly pivot at 12131 which held the market back until late morning.
How precise were my levels?
RES 1 held on the first attempt and produced a 1R 3Min Bolli; RES 2 was spot on and marked the HOD.
What I did

TOTAL = 2.5R | # Trades 9 | Winners 4 | BE 2
Average R per winner = 1.4 | Losses > 1R = 0 | Scratched = x
R-multiples: trades 2:1 or more = 4 | trades 5:1or more = 0
Outcome using standard TP strategy and same trades
2:1 trades (4R) + 5:1 trades (0 x 2.5R) + BE (0R) + Losses (-3R) = 1R
My results vs. SYS = +1.5R
ON TILT trades = 1(-1R)
Rule of 3 trades = 2 (-2R)
Scratched trades = 0 (variance vs. rules = 0R)
Average coherence 2.1
Today's most gorgeous setup
This was the sell at the monthly pivot at the open; this trade also counted as an opening spike with a 3Min Bolli. It made 4:1 and missed my 5:1 TP by just a few points, but considering the marekt only moved 50pts in the first hour, this was a good result.

For reference: 6 month cash chart at COB yesterday


